Global grain tradeflows & vessel lineups
Track global grain trade flows by origin, destination and commodity. Get real-time visibility into vessel lineups and wheat export data, then use historical flow patterns to anticipate demand, compare export competitiveness and act earlier on market shifts.
Key benefits
Read real demand before it hits price
Track where grain and oilseed demand is showing up through actual export flows, grain exports by country, destination patterns, and vessel activity. Connect trade flow data to S&D to confirm demand shifts before they are fully reflected in cash prices or futures.
Know what’s left to trade
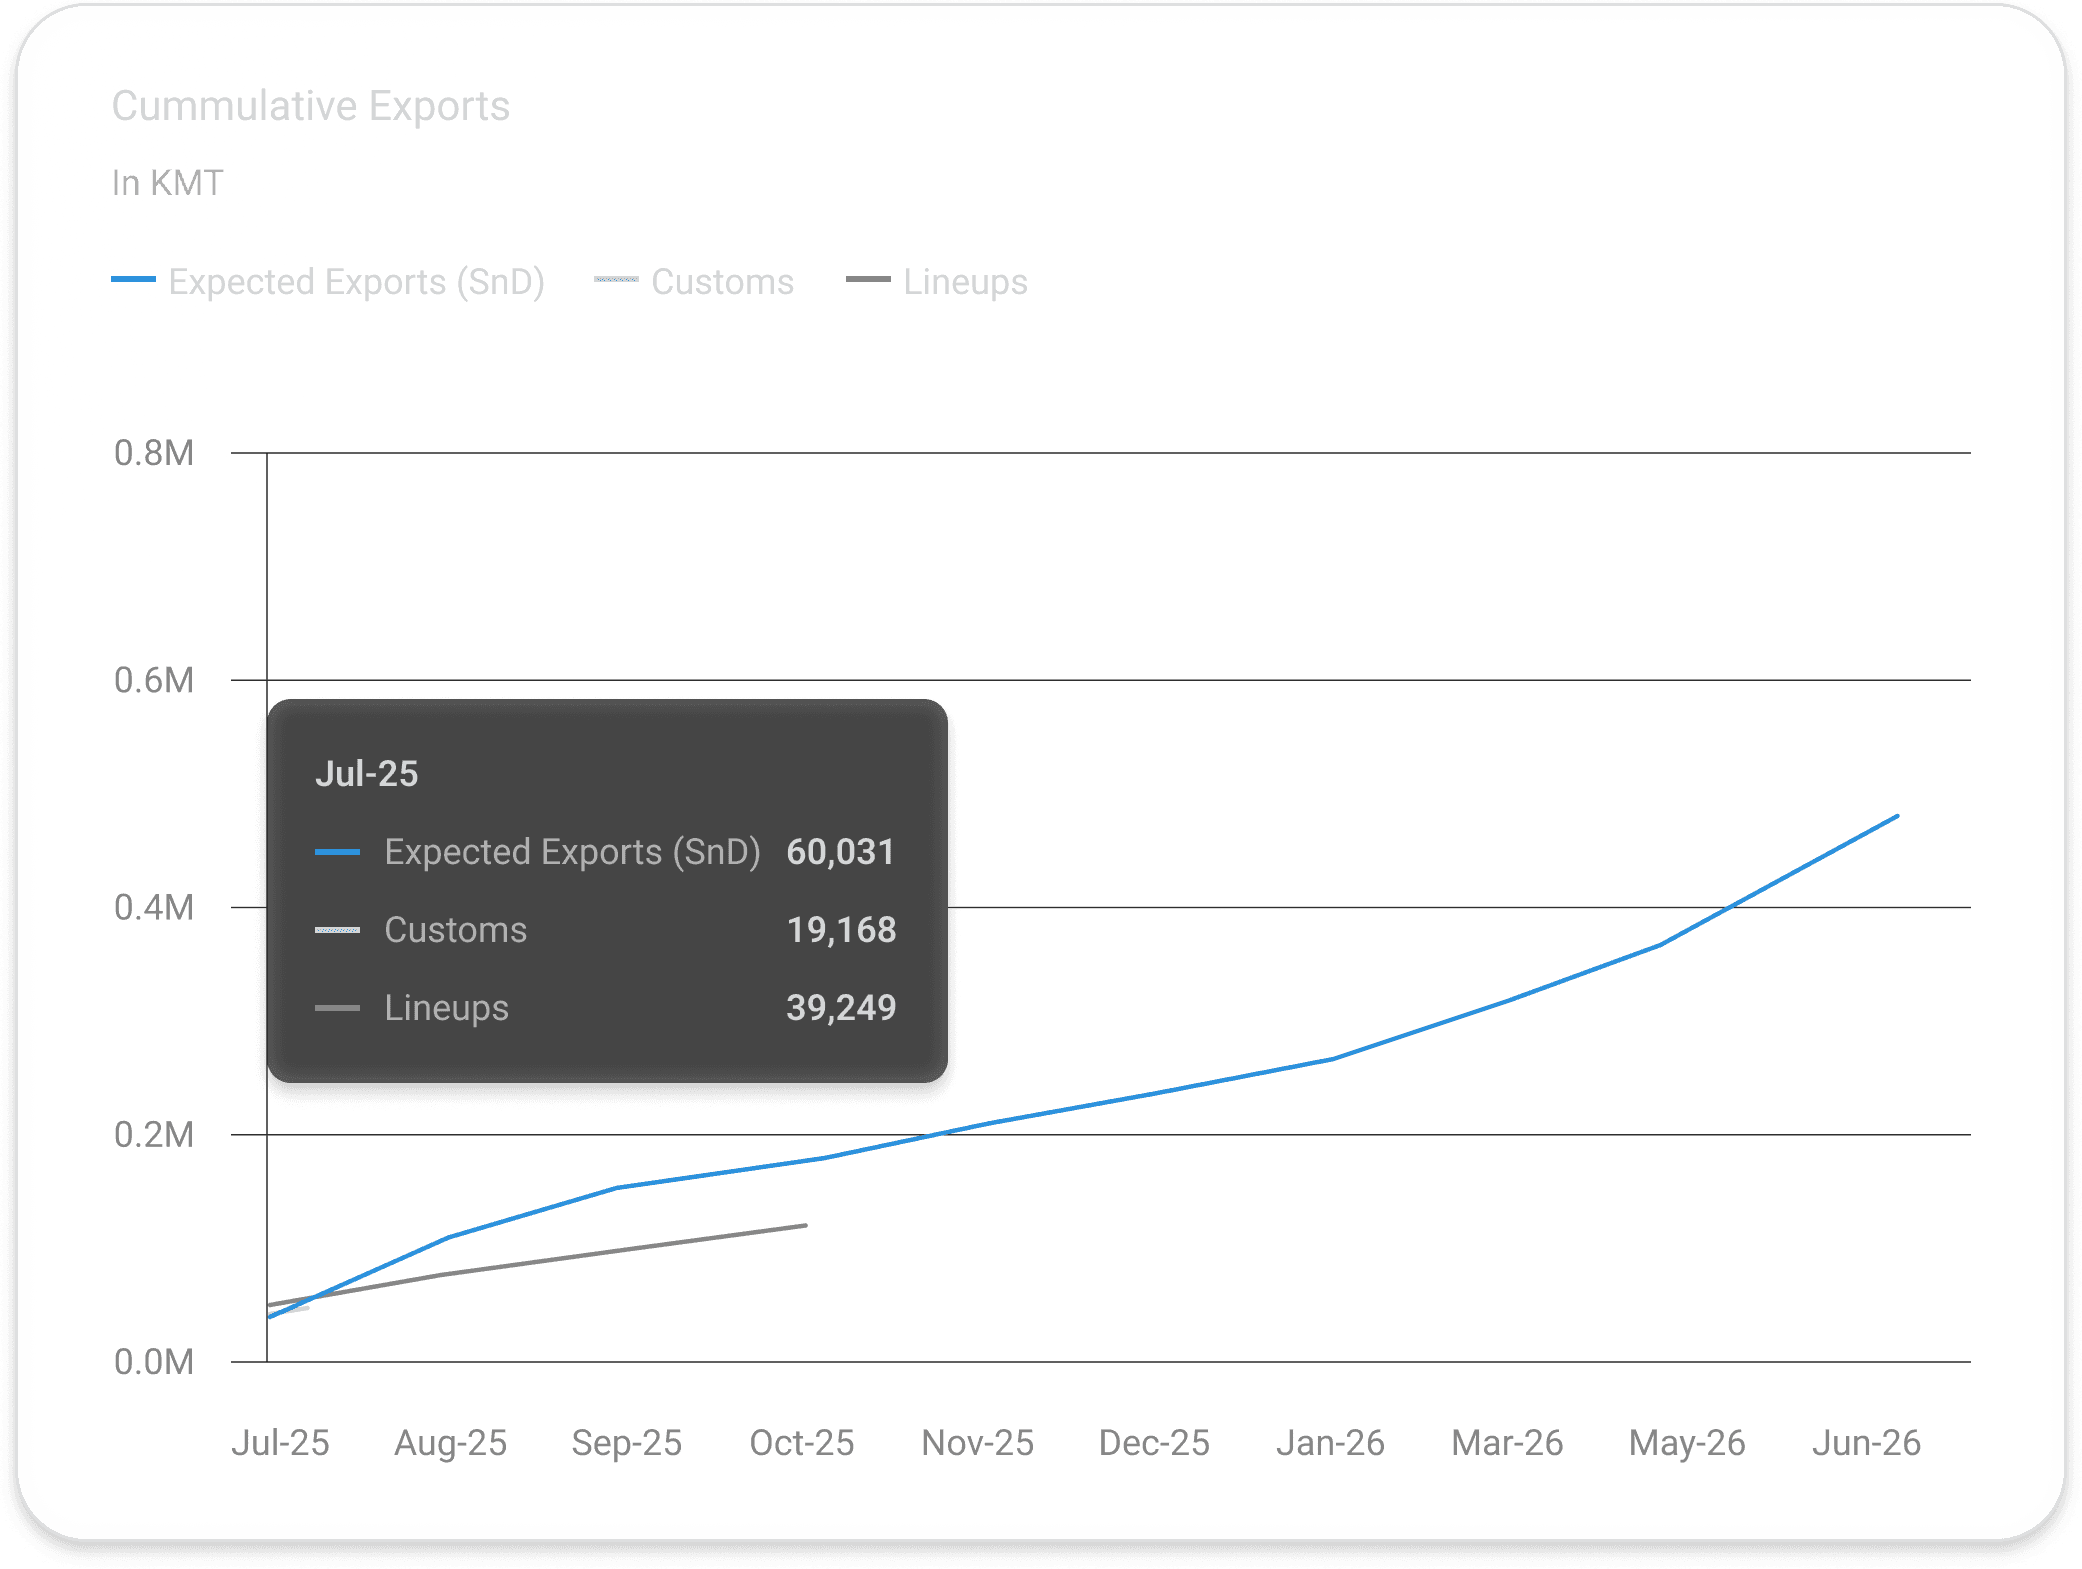
Compare vessel lineups at the Black Sea, US Gulf, Brazil, and Argentina alongside export pace and seasonal shipment patterns against S&D expectations. Understand how much grain has moved, how much may still need to move, and whether an origin is ahead or behind its expected export program.
Spot changes in trade momentum
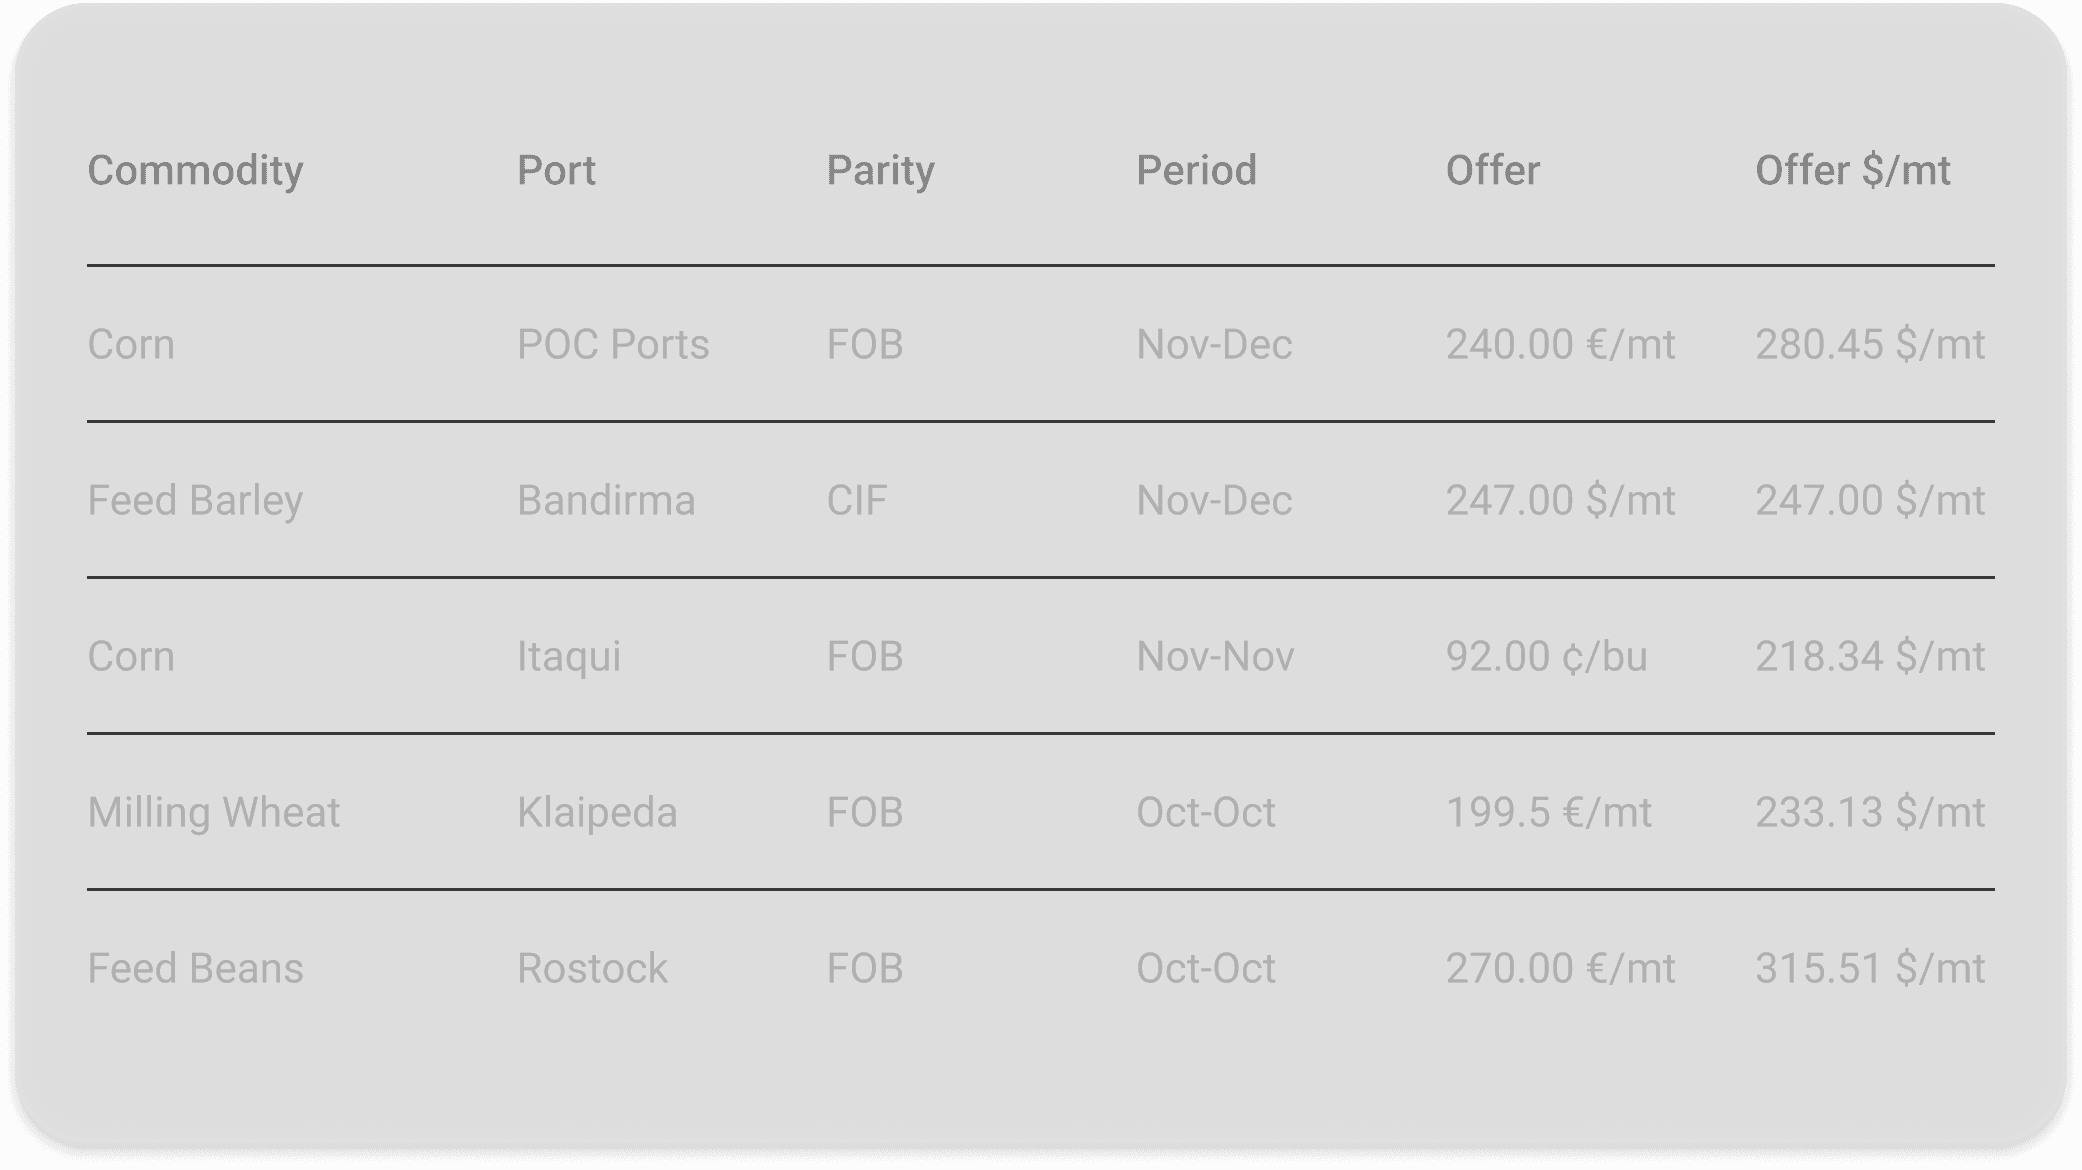
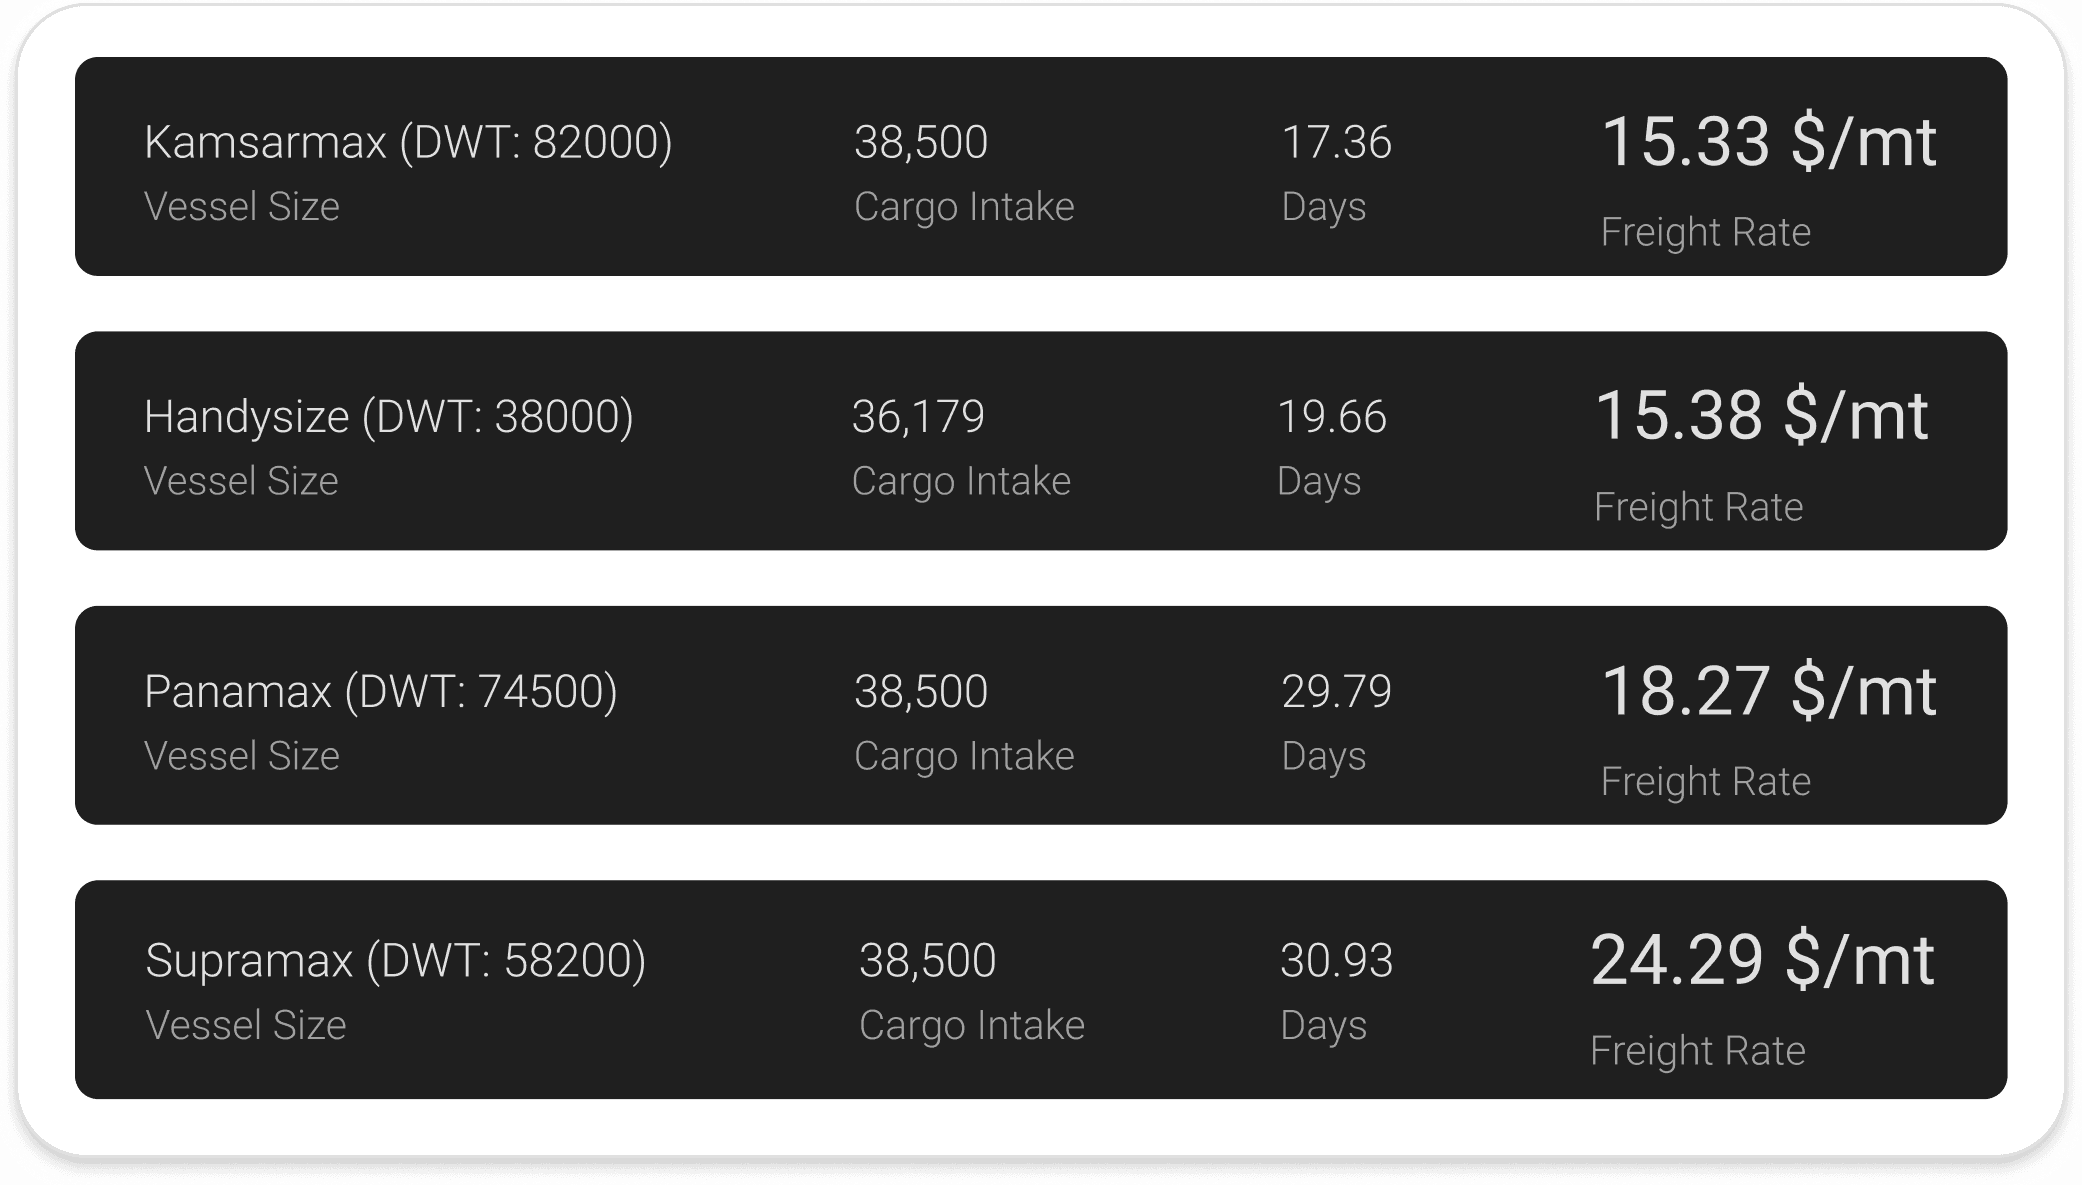
Combine FOB levels with freight indications to assess origin competitiveness, delivered value and potential margin opportunities.
Track cargo movements at vessel level
Follow grain exports, wheat exports, and corn exports through individual vessel movements, load ports, destinations, and shipment pace. Use 10 years of historical data and filter by crop year, region, country, commodity, or port to see what has shipped, what is loading, and how export activity compares with expected flows.
Frequently asked questions
CM Navigator lets you track grain and oilseed trade flows by origin, destination, commodity, crop year and shipment period. Use the data to follow export pace, destination demand and changes in trade patterns over time.
Trade Flows show the broader movement of commodities between origins and destinations over time. Our Vessel Lineups provide a granular view of individual vessels, loading programs and port activity at selected export origins.
CM Navigator covers trade flows for wheat, corn, barley, durum wheat, oats, peas, rapeseed, soybeans, sunflower and meals, including rapeseed meal and soybean meal.
In addition, CM Navigator provides detailed Baltic vessel lineup data for wheat and barley.
CM Navigator tracks grain and oilseed flows across major export corridors, including the Black Sea, Baltic Sea, Europe, Argentina, Brazil and the US Gulf.
Yes. Black Sea grain exports are a core part of CM Navigator’s Trade Flows coverage. Users can follow export pace, destination flows and vessel activity across key Black Sea origins and ports.
Vessel lineup data is sourced from a combination of proprietary broker networks, port agent reports and satellite tracking. Entries are reviewed to support data quality, consistency and market relevance.
Yes. You can filter trade flows by country to view import origins, export destinations, commodity flows and changes in shipment patterns over time.
Yes. Trade Flow and Vessel Lineup data can be accessed through CM Navigator’s API and integrated into internal tools, models, dashboards or reporting workflows.