Grain supply & demand forecasts - dynamic crop data

Grain S&D, crop forecasts, and production that move with the market

Track wheat, corn, and soybean supply and demand forecasts that update as crop conditions, trade flows, and market signals change. CM Navigator combines structured S&D data with weather monitoring, crop tours, and direct market engagement - not just monthly report cycles.

Screenshot of the CM Navigator supply and demand production and yield historical bar chart showing dynamically updated global grain production data and yield trends for crop forecast and market analysis
Icon representing timely supply and demand market intelligence to navigate grain market shifts and manage commodity price risk with confidence

Stay Ahead of Market Changes

Follow S&D forecasts that update as crop conditions, trade flows, weather and market signals change — not just when major reports are released.

Icon representing the ability to spot emerging grain market trends by exploring 15 years of supply and demand data across key exporting countries

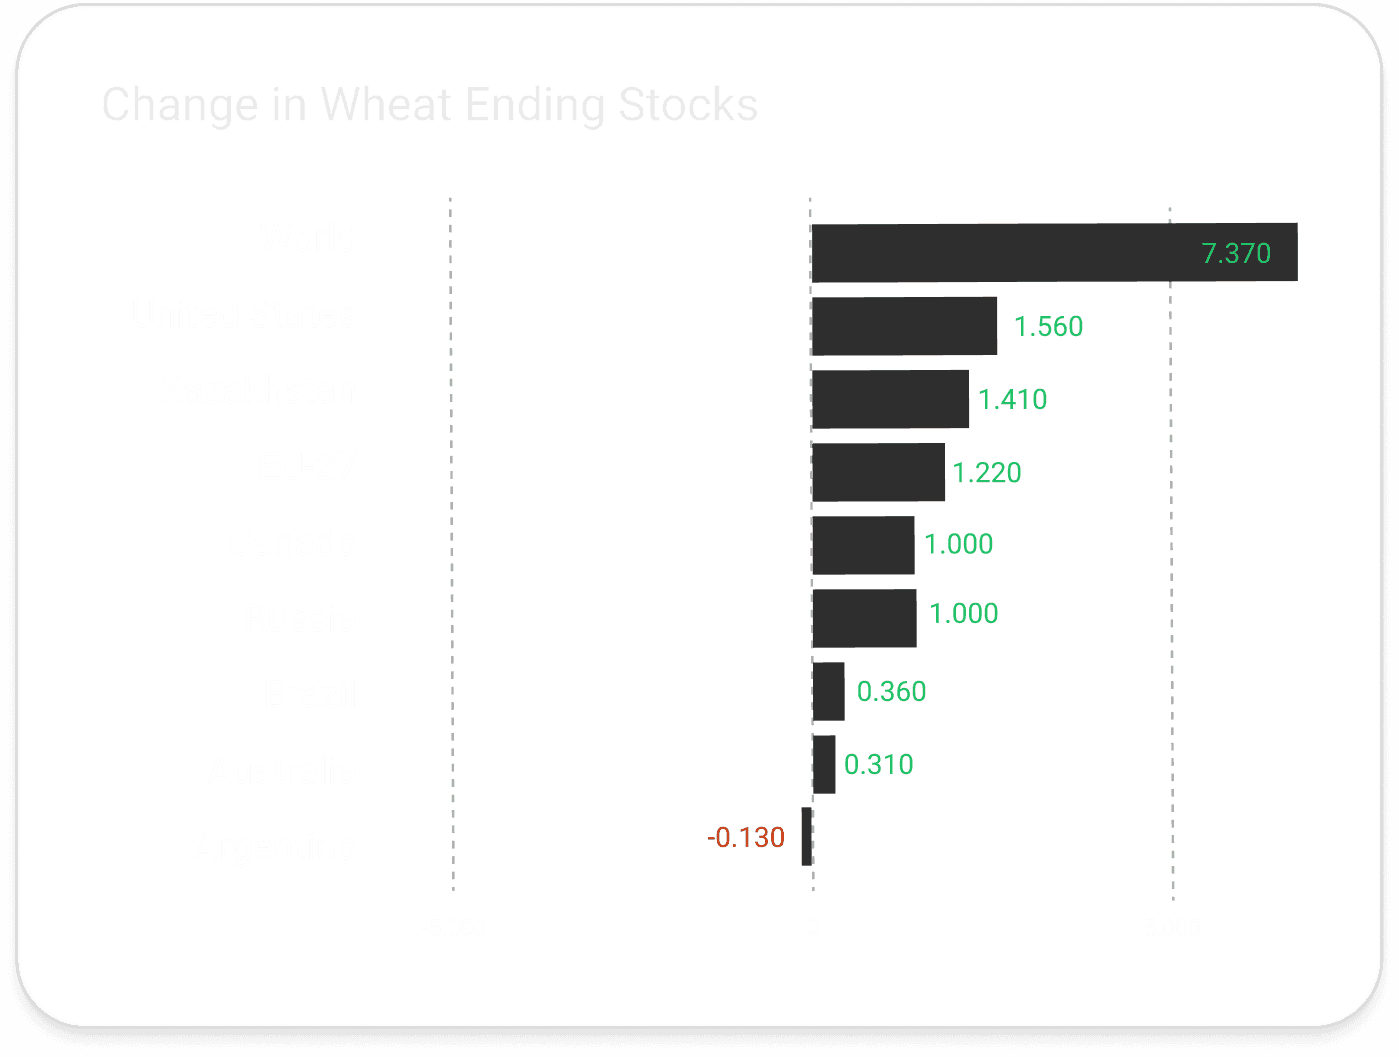
Analyse Country-by-Country Balance Sheets

Go beyond broad regional estimates with detailed S&D data by country, including production, imports, exports, consumption, stocks and stock-to-use.

Icon representing a unified view of grain market data including production, trade, stocks and stock-to-use ratios structured together in one platform

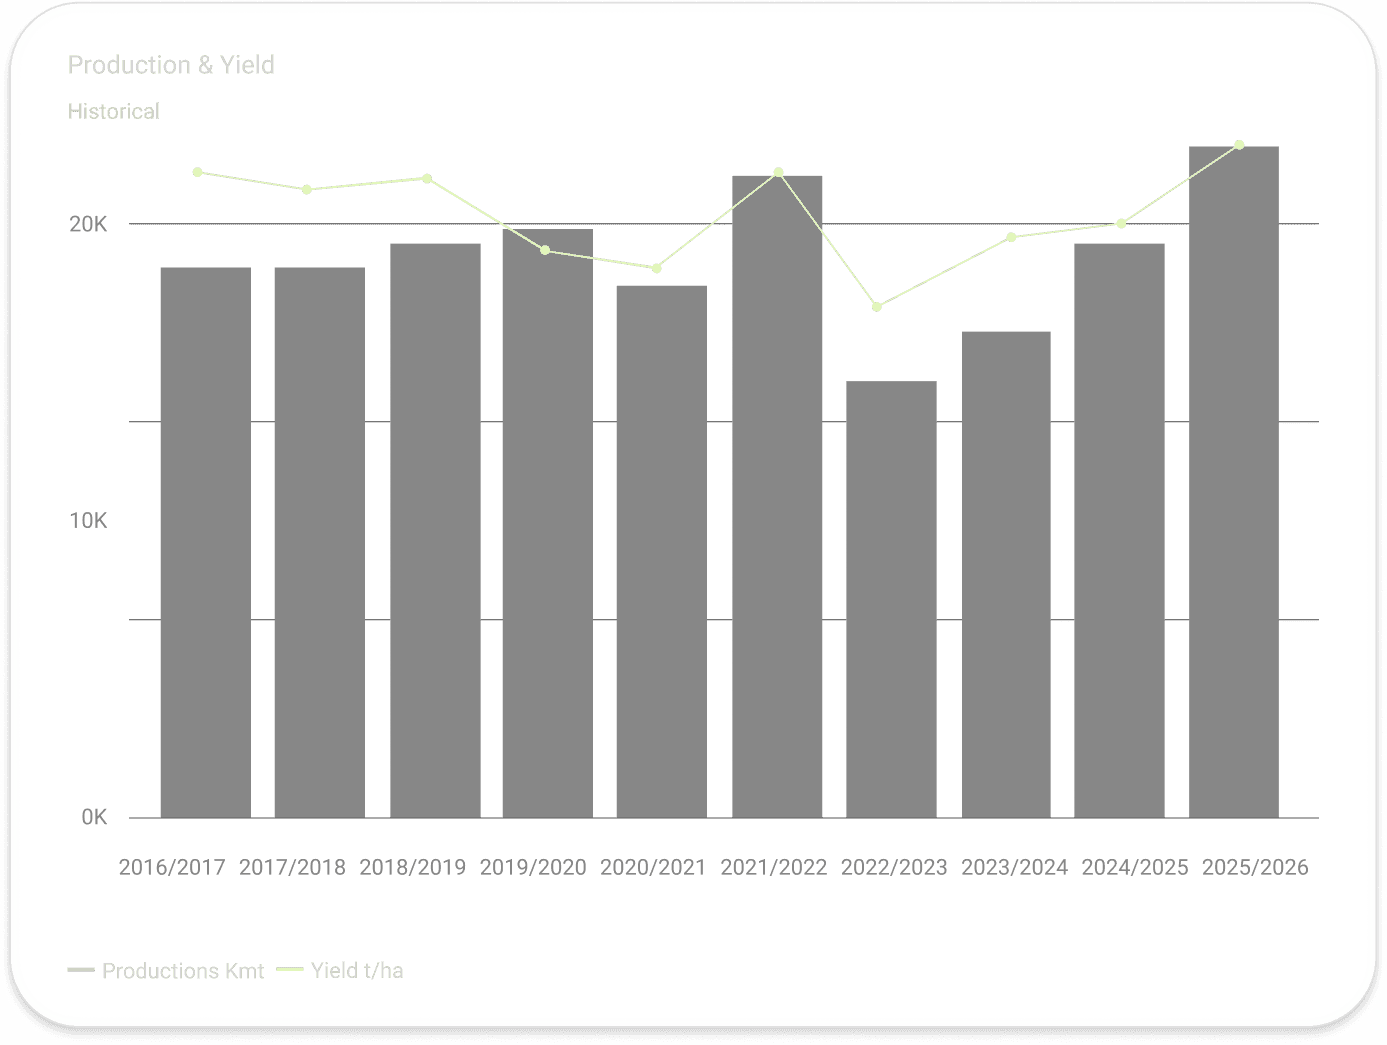
Spot Trends Across 15 Years of Data

Compare historical S&D patterns across key exporters and importers to identify shifts, anomalies and changing market structures.

Data visualisation showing change in global wheat ending stocks by country including World, US, Kazakhstan, EU-27, Canada, Russia, Brazil, Australia and Argentina for supply and demand crop forecast analysis

First-hand crop insight behind the forecasts

CM Navigator’s S&D forecasts are supported by direct engagement with farmers, collectors, traders and regional market participants. This gives our analysts first-hand visibility into crop development, quality, farmer selling, logistics and local market conditions.


By combining structured data with on-the-ground insight, our production forecasts go beyond models built only on published reports.

Dot globe data visualisation representing the comprehensive 19-year historical grain supply and demand data archive on the CM Navigator platform for spotting trends, patterns and anomalies

Historical Data

Put today’s balance sheet in context

Use 15 years of historical S&D data to compare production, trade, consumption, stocks and stock-to-use across countries and seasons. Identify patterns, anomalies and structural shifts in wheat, corn and soybean markets.

Grain coverage

Close-up photo of wheat grain representing wheat commodity freight rate coverage in the CM Navigator freight matrix for comparing sea freight costs by route and port

Wheat

Close-up photo of barley grain representing barley commodity freight rate coverage in the CM Navigator freight matrix for comparing dry bulk shipping costs across global routes

Barley

Close-up photo of corn kernels representing corn commodity coverage in the CM Navigator freight matrix for comparing dry bulk sea freight costs across global grain shipping routes

Corn

Close-up photo of durum wheat representing durum wheat supply and demand data coverage on the CM Navigator agricultural commodity market intelligence platform

Durum wheat

Close-up photo of soybeans representing soybean supply and demand balance sheet data including global crush, trade flows and ending stocks on the CM Navigator platform

Soybean

Close-up image of soybean meal representing protein feed supply and demand data coverage on the CM Navigator agricultural commodity market intelligence platform

Soybean meal

Trade flows feature tile showing global grain shipment tracking and trade flow data for commodity traders on the CM Navigator platform

Trade flows

Track commodity movements by origin, destination and commodity, with historical data to support forward trade analysis.

CFR matrix feature tile showing cost and freight price comparison across 610 global destinations for grain traders on the CM Navigator platform

CFR Matrix

Compare delivered values by combining origin prices and freight rates.

Don’t miss out

Start your free trial today

Begin your path to smarter trading now.

Start your 7-day free trial. No commitment.