CFR price matrix - compare cost and freight across 700+ destinations
CFR price matrix - compare cost and freight across 700+ destinations

See CFR price indications across origins, destinations and forward months in one matrix. Instead of calculating FOB plus freight manually, compare delivered values side by side in seconds.


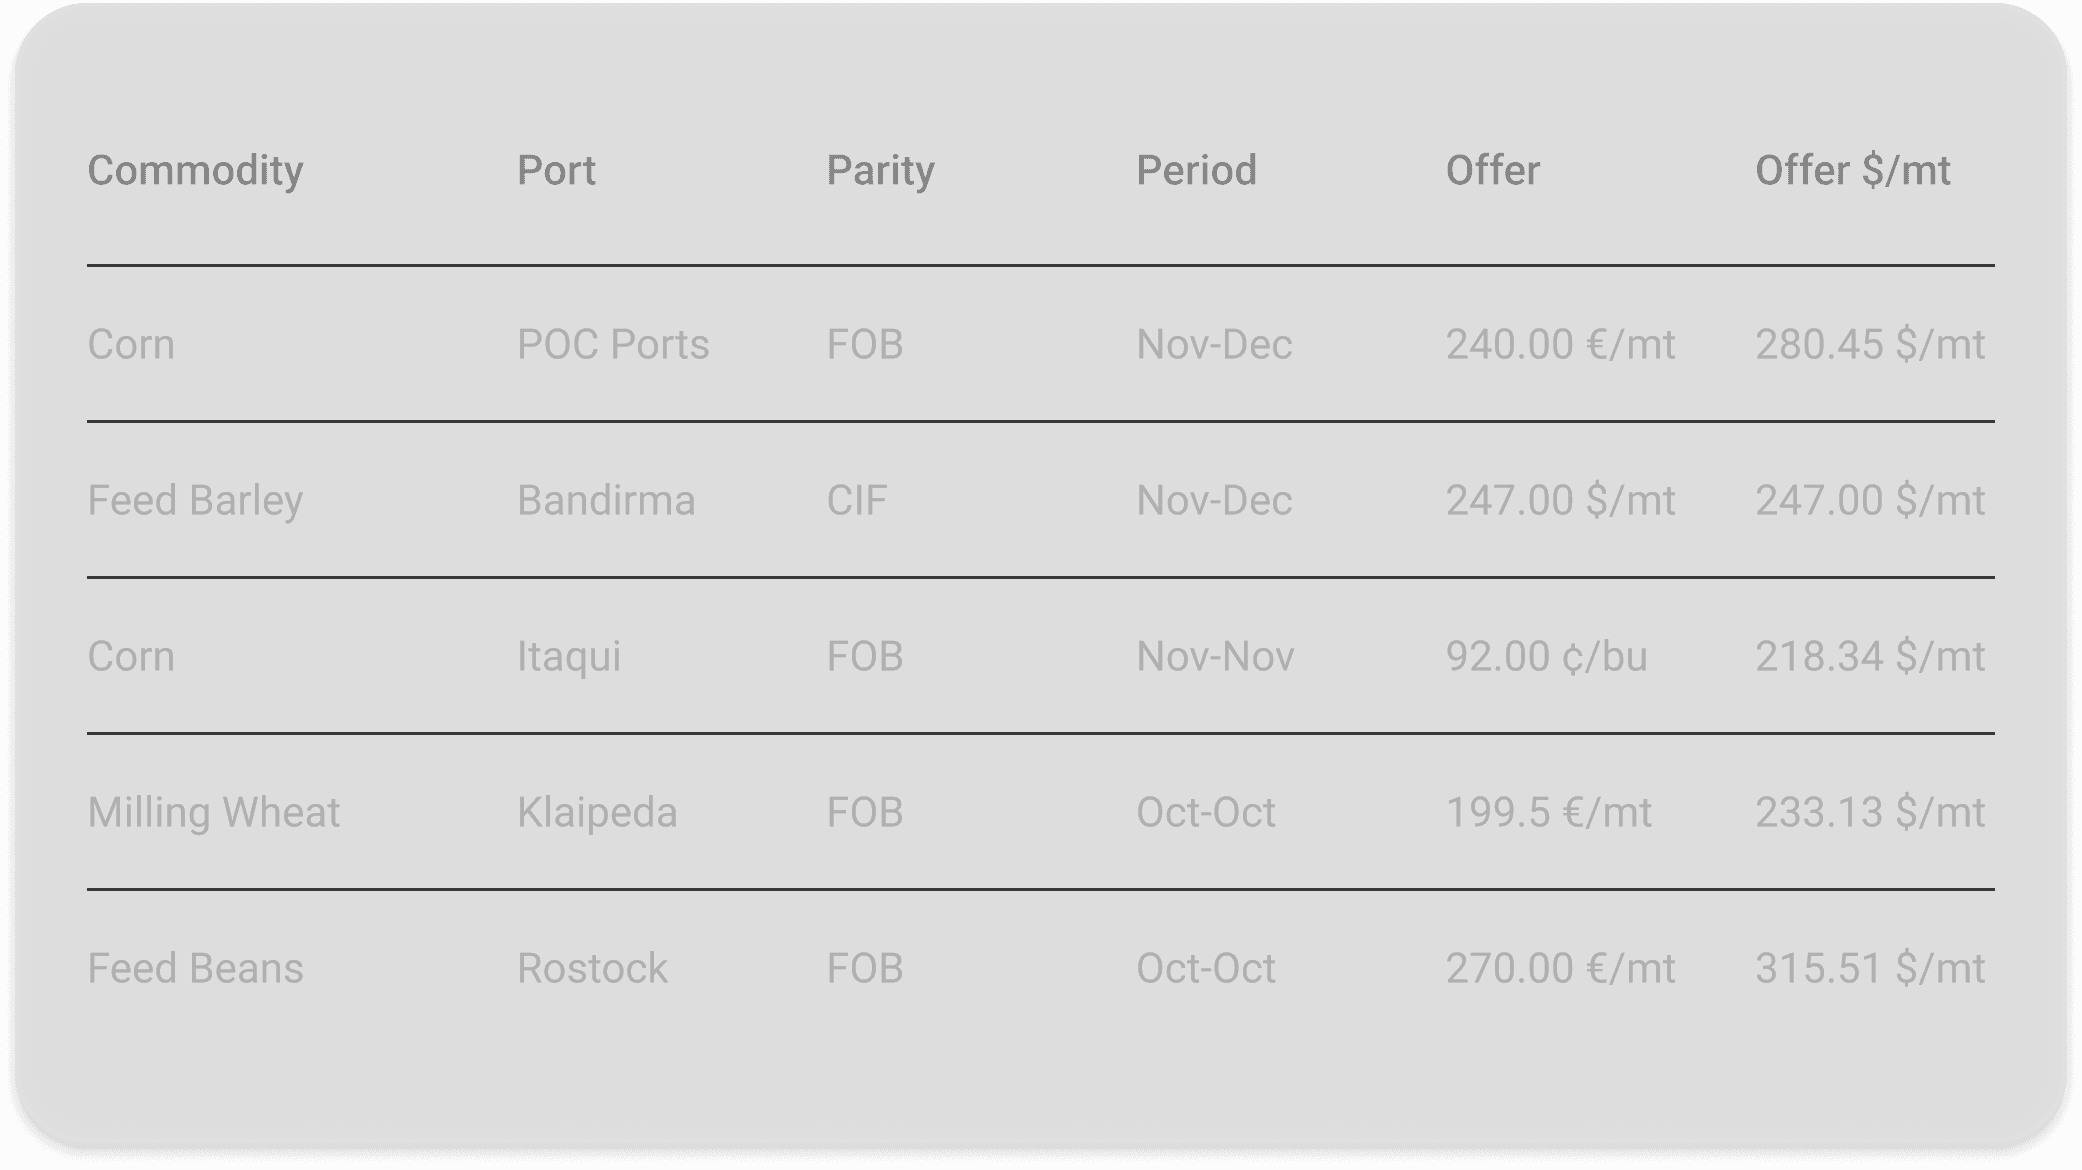
A CFR price shows the delivered cost of a commodity to a destination port, combining the FOB price at origin with the ocean freight cost. For grain traders, CFR prices make it easier to compare the real delivered value of different origins.
FOB shows the commodity price at the origin port, before ocean freight. CFR includes both the origin price and the freight cost to the destination port. That makes CFR the key comparison point when evaluating import cost and delivered competitiveness.
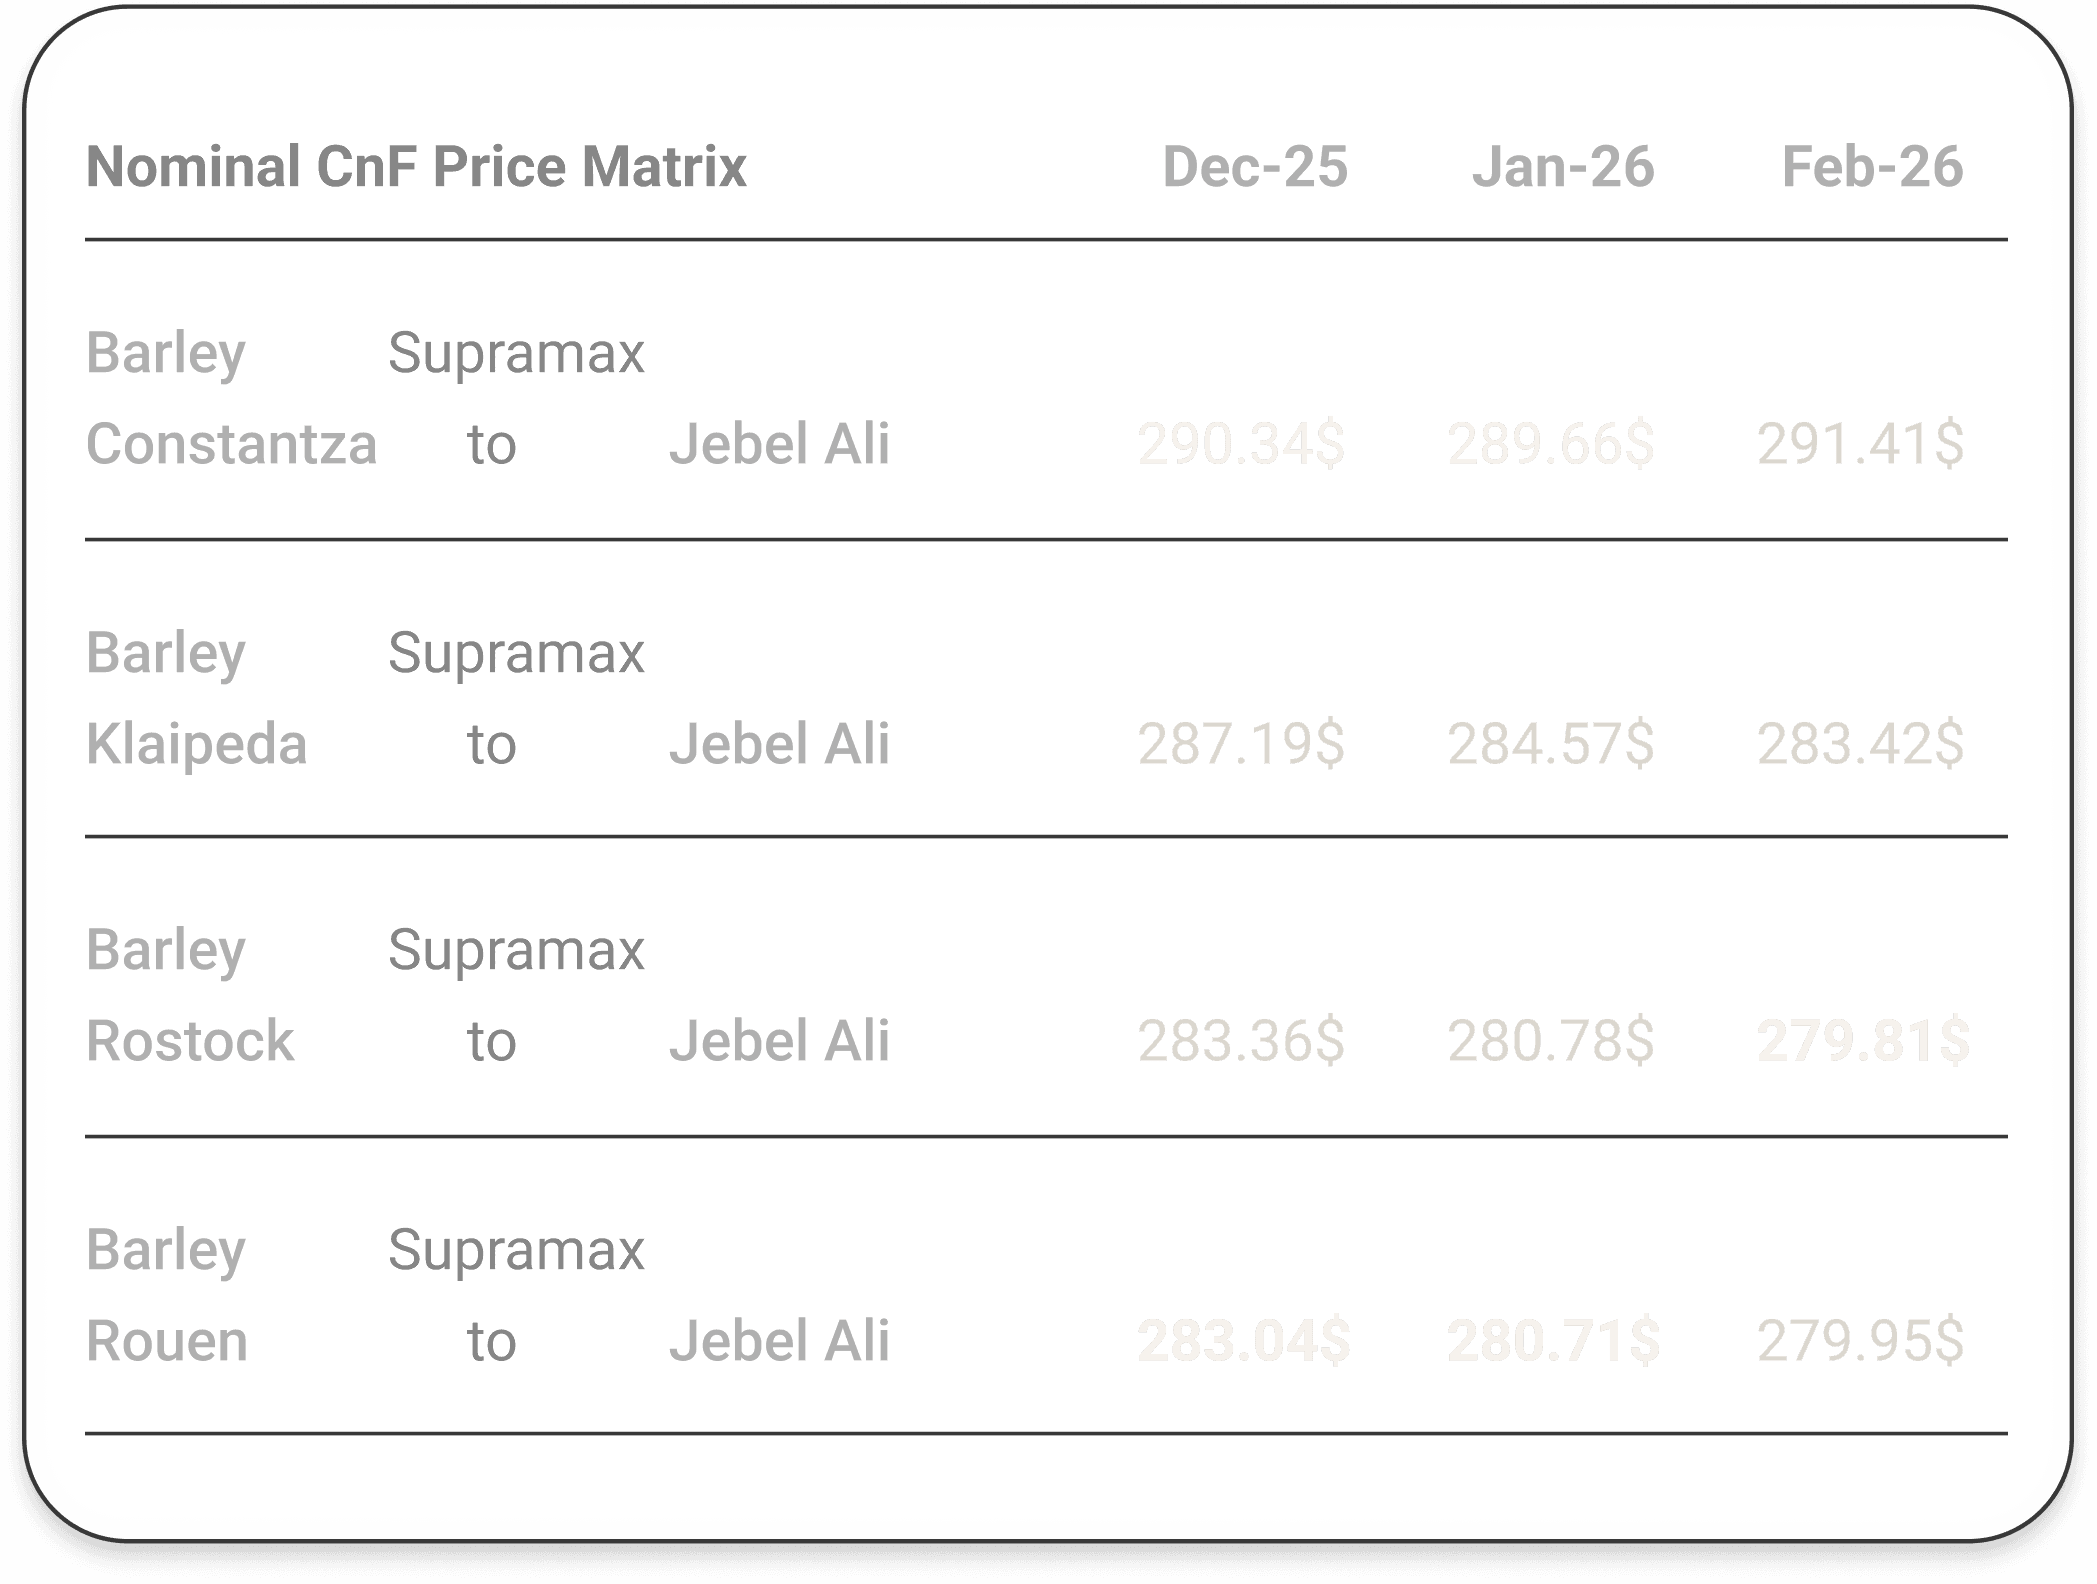
CM Navigator combines market-sourced FOB indications with dry bulk freight rates to calculate CFR price indications across origins, destinations and forward periods. This helps traders compare delivered values without building each FOB plus freight calculation manually.
Select the commodity, destination and shipment period to see CFR options ranked across available origins. This allows you to compare which origin offers the strongest delivered value into a specific destination.
The CFR Matrix covers key agri commodities including wheat, barley, corn, soybeans and soybean meal across 710 destination ports.
CFR prices are updated daily using current FOB indications and freight inputs, giving users an up-to-date view of delivered market values.
Yes. CM Navigator includes an 8-month forward curve, allowing you to compare how CFR values change across future shipment periods.
Yes. CFR prices help importers and traders compare delivered cost across origins, identify competitive supply routes and assess where margin opportunities may appear.
See which origins are most competitive into each destination once freight is included, and track how that changes across shipment periods.

Identify pricing gaps created by changes in FOB levels, freight rates and forward curves before they are fully reflected in the market.