Dry Bulk Freight Rates - Compare Routes & Costs
Dry Bulk Freight Rates - Compare Routes & Costs

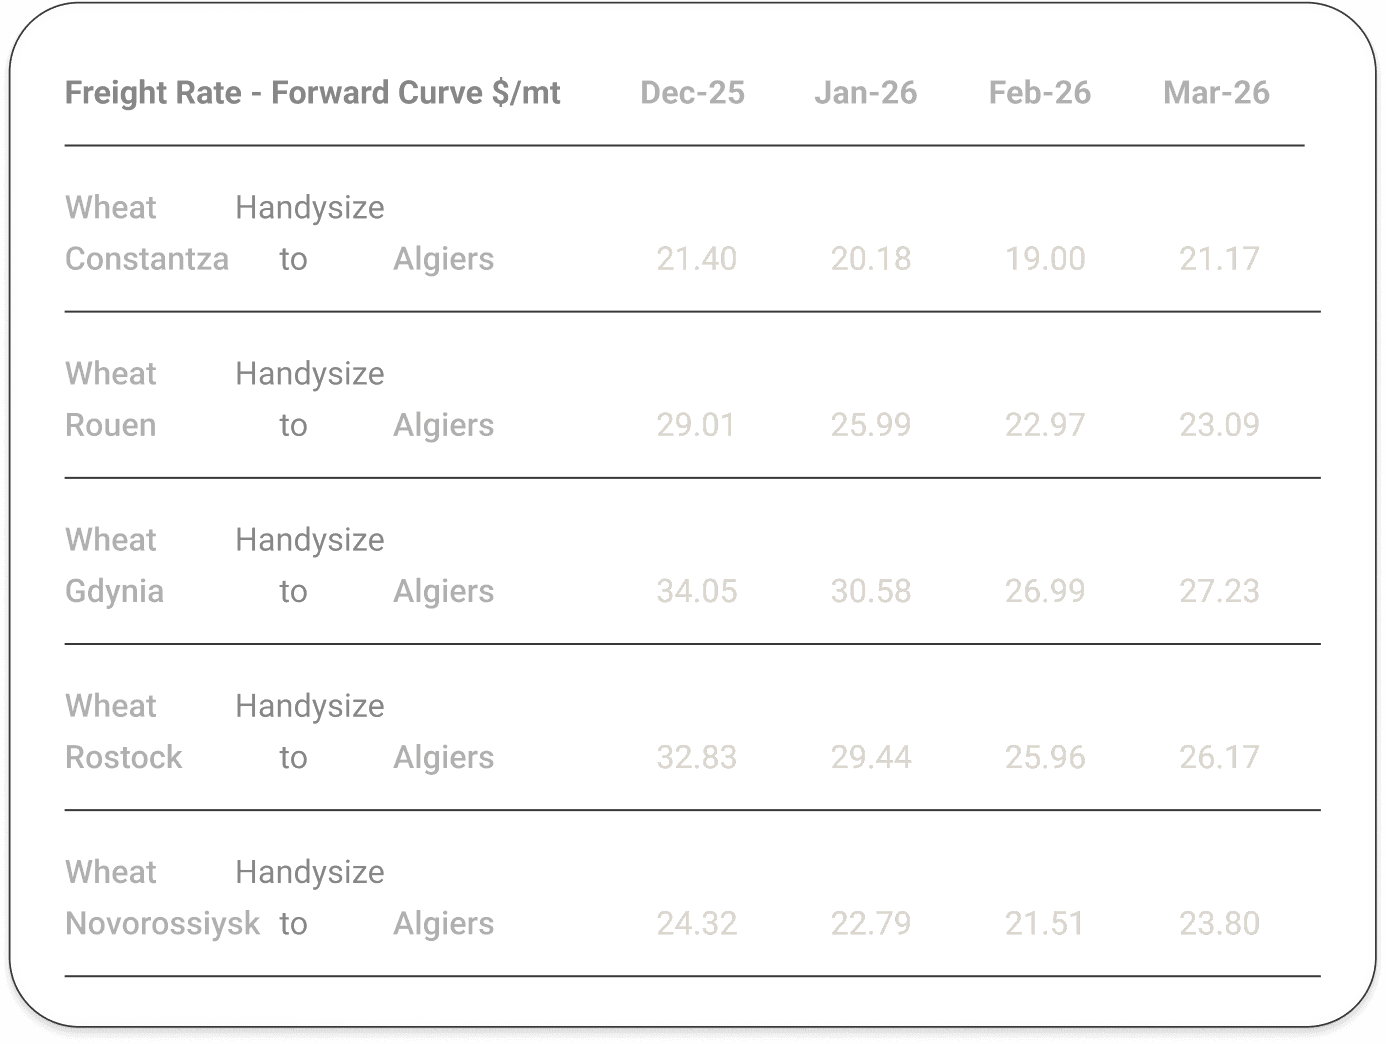
See freight rates across routes, vessel sizes, commodities and forward months in one structured overview. Instead of checking routes one by one, the Freight Matrix lets you compare the market at a glance and move faster from question to decision.

Track how freight spreads shift across origins, destinations and shipment periods. Use the forward view to see where delivered economics are improving or weakening — and identify the routes that may create better margin opportunities.

The Freight Matrix gives a structured overview of dry bulk freight rates across routes, vessel sizes, commodities and forward months. It helps traders compare freight levels quickly and understand how route economics change over time.
A spot freight rate is the current market level for shipping cargo on a specific route. CM Navigator displays spot freight indications across major dry bulk and agri routes, updated daily.
Yes. The Freight Matrix includes a 12-month forward curve, allowing you to compare freight rates across shipment periods and see how route competitiveness may change over time.
Dry bulk freight rates are shaped by vessel supply, cargo demand, route distance, bunker prices, port congestion, seasonality, canal costs and regional risk premiums. CM Navigator tracks these inputs to reflect current and forward market conditions.
The Baltic Dry Index is a benchmark indicator for global dry bulk freight markets. CM Navigator complements broader market indicators like the BDI with route-specific freight data for agri and dry bulk commodity trades.
CM Navigator covers 850,000+ freight rates across major agri origins and destinations, including the Black Sea, Europe, South America, the US Gulf, North Africa, the Middle East and Asia.
Freight Matrix data is updated daily, helping users compare current freight levels and forward route economics with up-to-date market inputs.
The Freight Matrix is built for comparing many routes, vessel sizes and forward periods in one overview. The Freight Calculator is built for modelling a specific freight scenario in more detail, with hourly updated inputs, cargo terms, multi-port structures and a full voyage cost breakdown.